-
Notifications
You must be signed in to change notification settings - Fork 9
Exercise B: The Closure Test
- “You must not fool yourself, and you are the easiest person to fool" -Feynman
- The closure test gives the collaboration confidence that your cross-section script is correctly working and doesn't have any lurking bugs giving bad results. This is done by showing that your differential cross-section results are equal to an external MINERvA cross-section script where both differential cross-sections are based on your signal definition. For this exercise, the closure test is performed by comparing the simulation (GENIE Minerva-v1 tune) differential cross-section produced by
ExtractCrossSection(pretending it's your personal method) to the simulation (GENIE Minerva-v1 tune) differential cross-section produced byGENIEXSECEXTRACT(MINERvA's standardized method).
The actual closure test consists of:
- Extract a cross section treating the MC as the data too
- Extract a cross section with a GENIEXSecExtract-derived executable
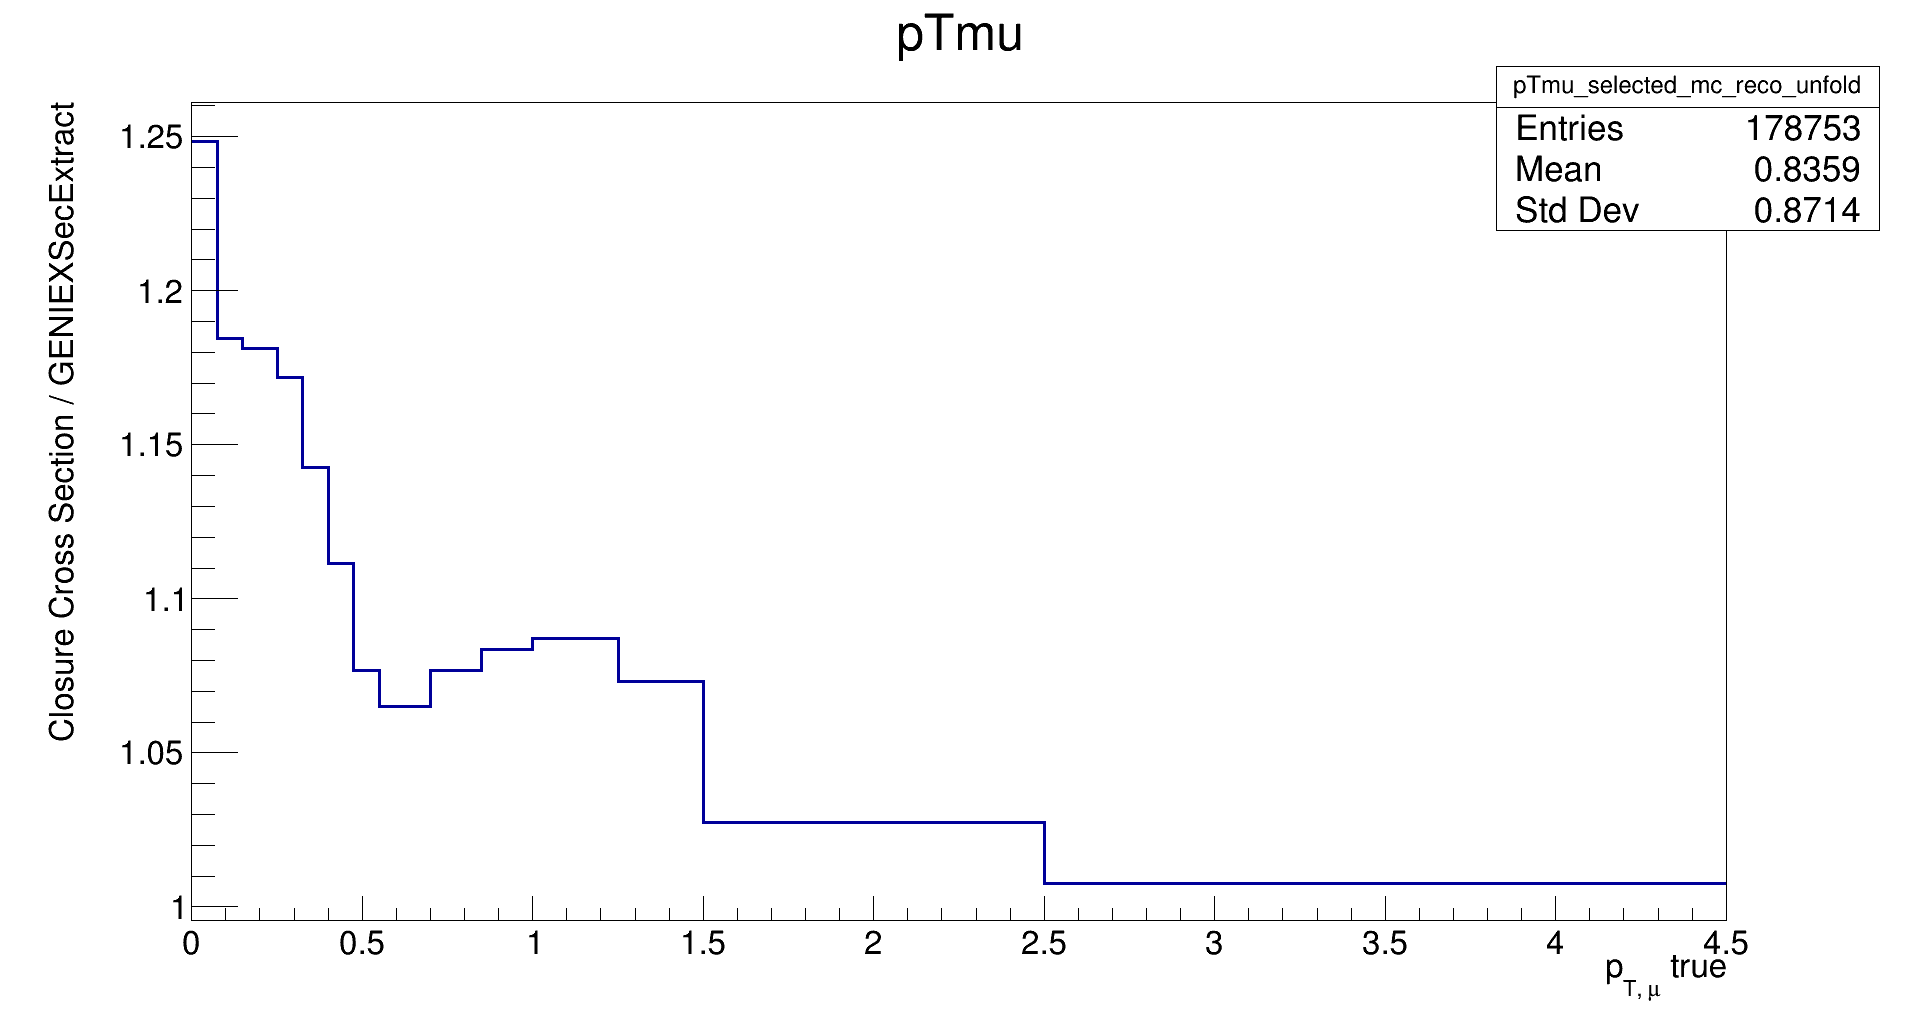
- The ratio must be flat and within 0.1% of 1
Unfortunately, this rarely works on your first few tries. So far, GENIEXSecExtract is completely independent of your analysis signal definition, so discrepancies between signal definitions are common. Our machinery for dealing with the flux also got much more complicated when we realized that the Medium Energy era flux delivered was not what we planned for. There are 3 more steps you can do to help isolate problems in your analysis' closure test. Most analyzers start here in practice:
- Efficiency numerator = unfolded MC-treated-as-data
- Efficiency denominator =
pT_xsec_evRateYou can also check that MC selected signal in reco variables = projection of migration matrix onto reco axis.
Refer also to Ben's MINERvA Closure Guide for a bit more detail on what specifically is being plotted and compared in these tests.
- This is the step you show to the whole collaboration to show that your analysis closes. You could skip straight to this step and maybe even succeed if you're lucky. But you'd have a lot of debugging to do if you failed. Most analyses do fail step 2 the first time they try to run it.
- Shape differences might mean:
- Signal definitions are not identical
- Unfolding is not closing
- Your "MC bkg" subtraction is not correct
- Normalization issues will come in a few varieties
- your fiducial volumes in the analysis and GXSEC aren't identical
- you used the wrong flux
- you used the wrong number of planes for the number of targets
- Wrong splines (would be a small effect I suspect)
Verify that the main branch of this tutorial passes the closure test:
#from opt/build...
cd ../../MINERvA-101-Cross-Section
git checkout main
cd ../opt/build
make install #Build the main working copy again
You might recognize these steps from the beginning of exercise A. In general, when I ask you to move to a different git branch, you need to do this. Updating the code doesn't update the programs!
- From the Event Rate step you should have produced an MC root file, with this root file you want to extract a cross-section using ExtractCrossSection , by running this command
ExtractCrossSection 1 runEventLoopMC.root runEventLoopMC.root - You want to now use
GENIEXSECEXTRACTto extract a cross-section to compare too. In the /test directory you runrunXSecLooper MAD_minervame1A_MC_andrewsGPVM.txt #Only argument is the MC playlist file you made/found in Exercise A - Once you have two root files, one from runXSecLooper (GENIEXSECEXTRACT) and the other from ExtractCrossSection (Your cross-section script) you want to check that they produce the same result (to about 0.1%) the easiest way to do this visually is to make a ratio plot of the cross-sections. Typically, you'll use your own plotting scripts and make "pretty plots", but you can also do this quickly by using Root interactively.
- First you want to open root with two attached root files, this can be done by
root -l file1.root file2.root - Next you want to make a histogram object so you can perform operations on it. The Root files are label as _file0, _file1, ...
- These objects(_fileN) are TFiles and you can perform c++ operations just as in a script
- From each object you want to get the histogram (MnvH1D) that is the cross-section and take the ratio and draw() it!
- you can look here, https://root.cern.ch/doc/master/classTH1D.html or here https://cdcvs.fnal.gov/redmine/projects/minerva-sw/repository/entry/AnalysisFramework/Ana/PlotUtils/PlotUtils/MnvH1D.h to see the c++ operations for the histograms.
- First you want to open root with two attached root files, this can be done by
- to make ratio interactively
_file0->cd()auto denominator = (PlotUtils::MnvH1D*)(gDirectory->Get("nameofhist1"))_file1->cd()auto numerator = (PlotUtils::MnvH1D*)(gDirectory->Get("nameofhist2"))numerator->Divide(numerator, denominator)numerator->Draw("HIST")
I've broken runEventLoop in subtle ways on branch Exercise-B-Bonus. If you check out that branch and attempt the closure test, you should get plots like this:

Use the debugging closure sub-steps and compare runXSecLooper to runEventLoop to see if you can fix this analysis. This is more like what happened to me the first time I tried to run the closure test. To see the solution, learn to use git diff across branches and compare to main.