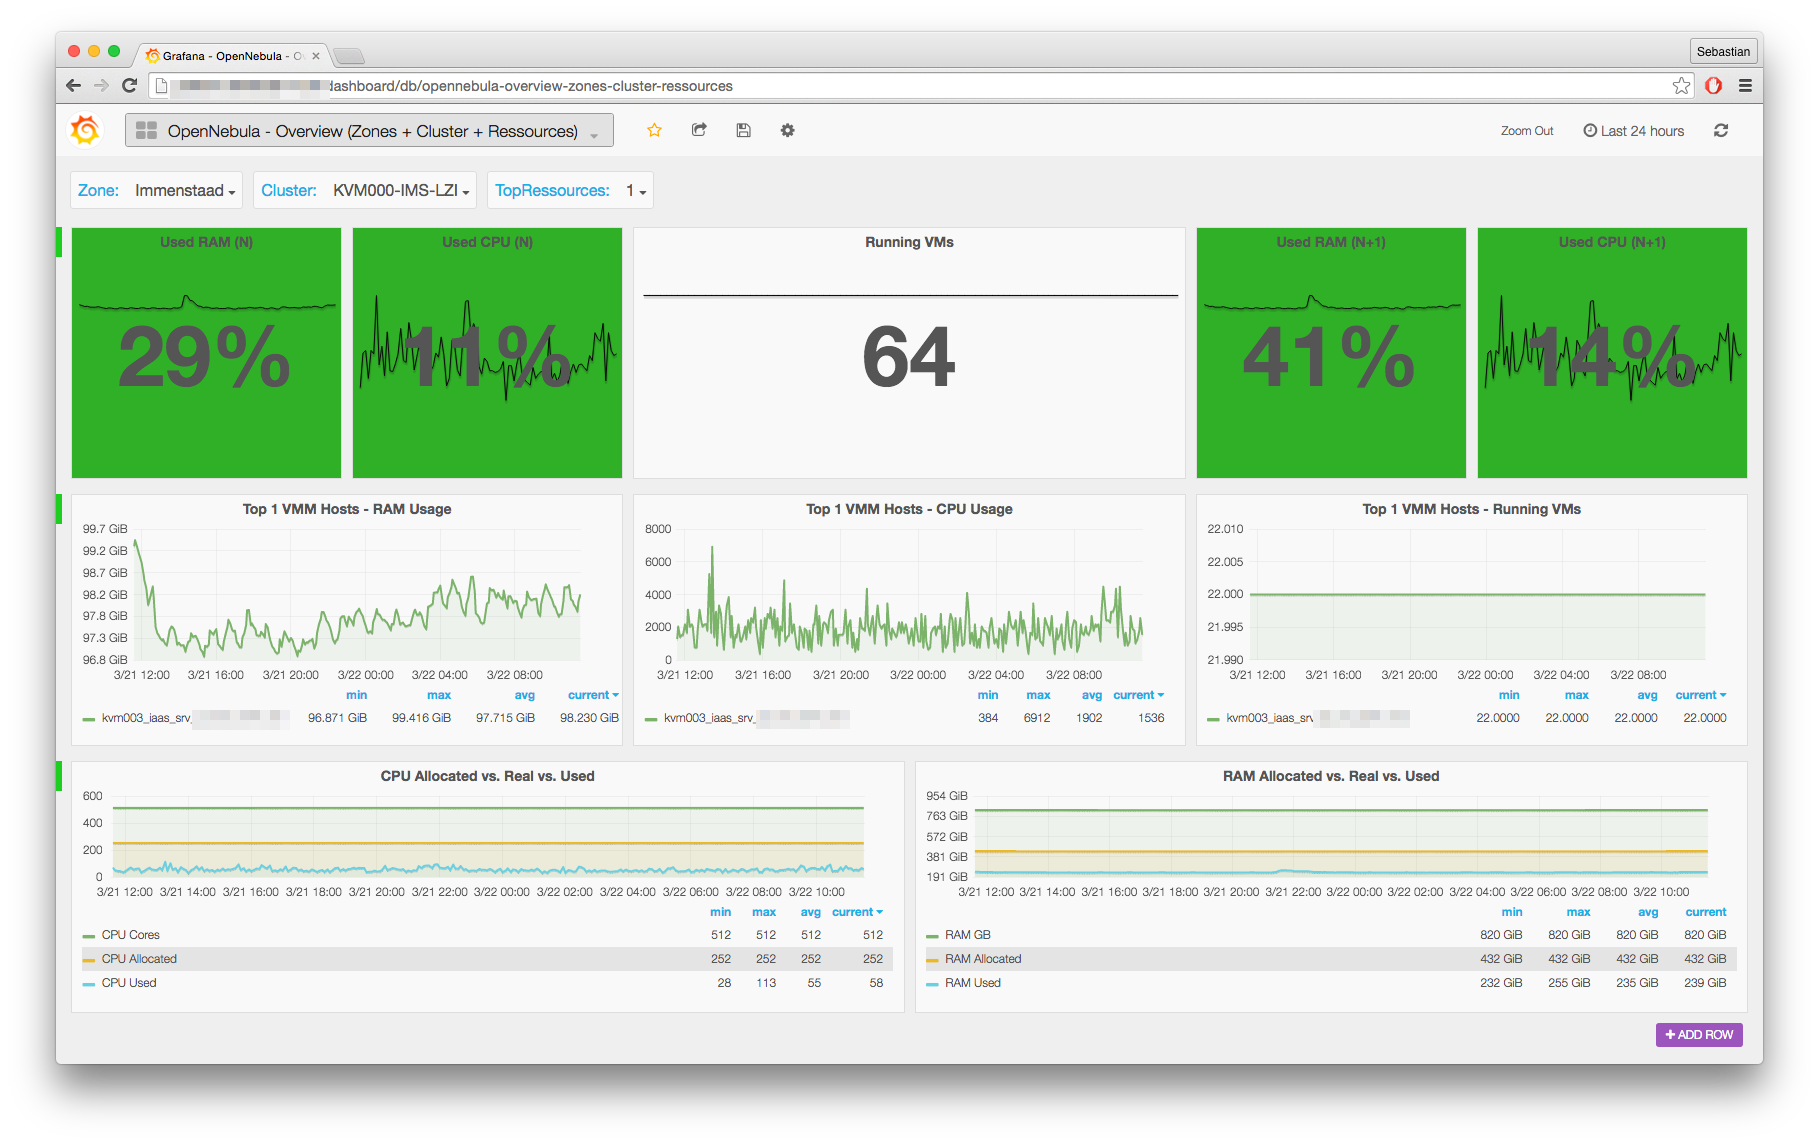
This script is a simple tool to gather some useful informations
out of OpenNebula by calling the known OpenNebula utilities
and parse their XML outputs. The primary goal is to build
a solution for long-term statistics and capacity management.
It is not a replacement, but a addon, for common system management and monitoring (!).
The script was developed to work with OpenNebula (4.14).
- GNU/Linux OS
- Cron
- Ruby
- Gem: "nokogiri" (for XML operations)
- Gem: "simple-graphite" (to push metrics to Graphite)
The ruby script "one-graphite.rb" is beeing executed on the OpenNebula Host running oned every 5 Minutes by Cronjob. The script calls known commands like "onehost -x" or "onegroup -x" and parses the XML output for the wanted information and pushed them to Graphite. The informations stored in Graphite could be uses for building Dashboards and Graphs for long-term statistics and operations (f.e. Big Screen/TV with your Cloud-Dashboard).
Some exported Grafana Dashboard definitions are included as importable JSON files.
Before the script sends the first metrics to graphite you have to create the storage schema in Graphite. We use the following definition:
[opennebula]
pattern = ^opennebula-performance.*
retentions = 5m:100d,10m:1y,30m:5y#
-
Move the small script to your desired location like
/usr/local/bin/ -
Create a Cronjob which executes the script every 5 Minutes (
*/5 * * * * /usr/local/bin/one-graphite.rb >/dev/null 2>&1) and ensure that the script is excecuteable -
Wait some cycles for the first metrics
-
Import the Grafana Dashboard JSON
-
Enjoy your OpenNebula Performance Dashboards
- debian GNU/Linux Jessie
- OpenNebula 4.14
- Graphite 0.9.10
- Grafana v2.6.0 (2015-12-14)
