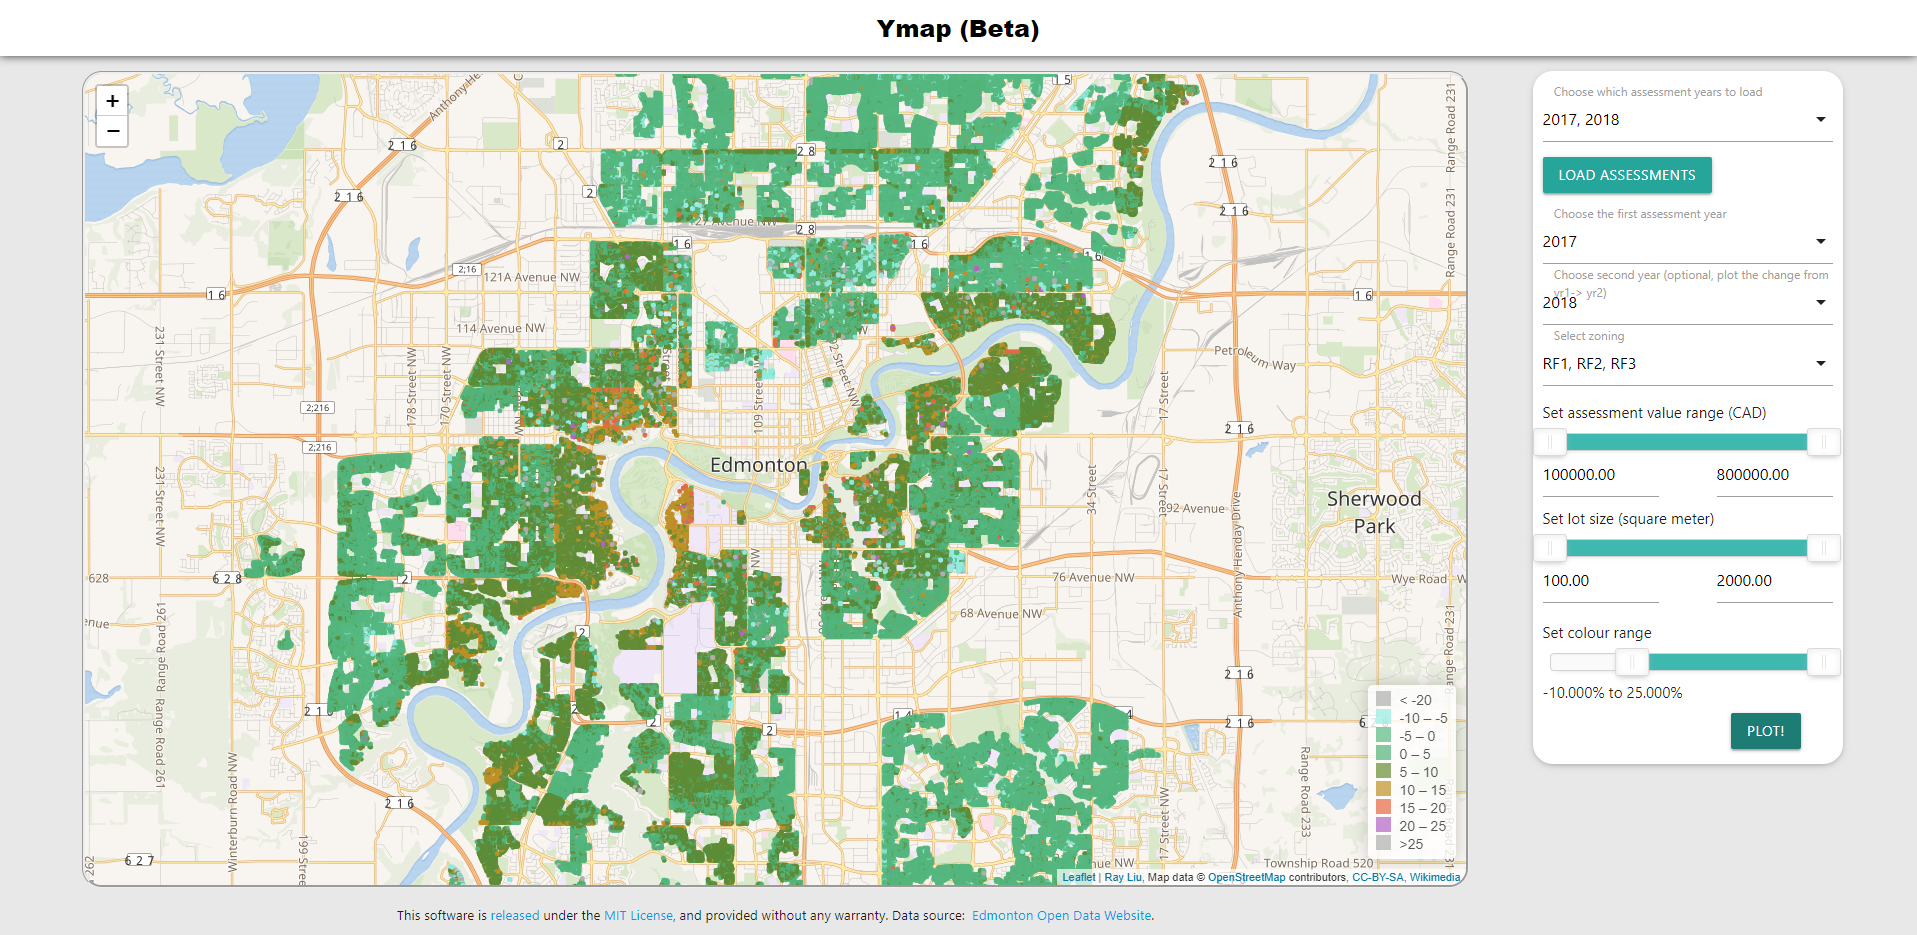
Ymap is an open-sourced, accessible, and interactive tool to visualize geospatial data.
- Uses HTML and JavaScript
- Tested with Chrome and FireFox
- Accessible on all OS
- Compare between any two data sets (or just plot one)
- Filter with parameters of your choosing using sliders and menus
- Change the colour scale
- Points stay at the real world size regardless of the zoom
- Ymap can choose any two data sets and compare dynamically. Useful when there are many data sets
- Flexibility: you want to plot the arctan of your data? Go into the lib.js file and do it within a minute
The default example is to study the property assessment trend in Edmonton, Canada. Here you can plot a single year of assessment or compare the change between any two years while filtering the data set based on zoning, assessment value, and lot size.
Try it out online at ymap.rayliu.ca
Ymap needs some external scripts to work properly:
- Leaflet - Create the map!
- noUiSlider - Good-looking sliders
- Wnumb - Format numbers
- RequireJS - Get the data files
- MaterializeCSS - Fancy text boxes and menus
To plot your own data, there are some things you will need to do
- Replace the example data with your data (obviously)
- Update the config.js file to your desired settings
- Update the HTML code to match your text
For the necessary file and data structures, see here
- Add statistical analysis of the plotted points (mean, weighted mean, median, mode, FWHM?, fast Fourier transform??)
- Add a plot with the distribution of parameter 1 and 2
- Add another example
- Auto update HTML texts from the config file
- Prettify the UI and its responsiveness
This repo is released under MIT license


