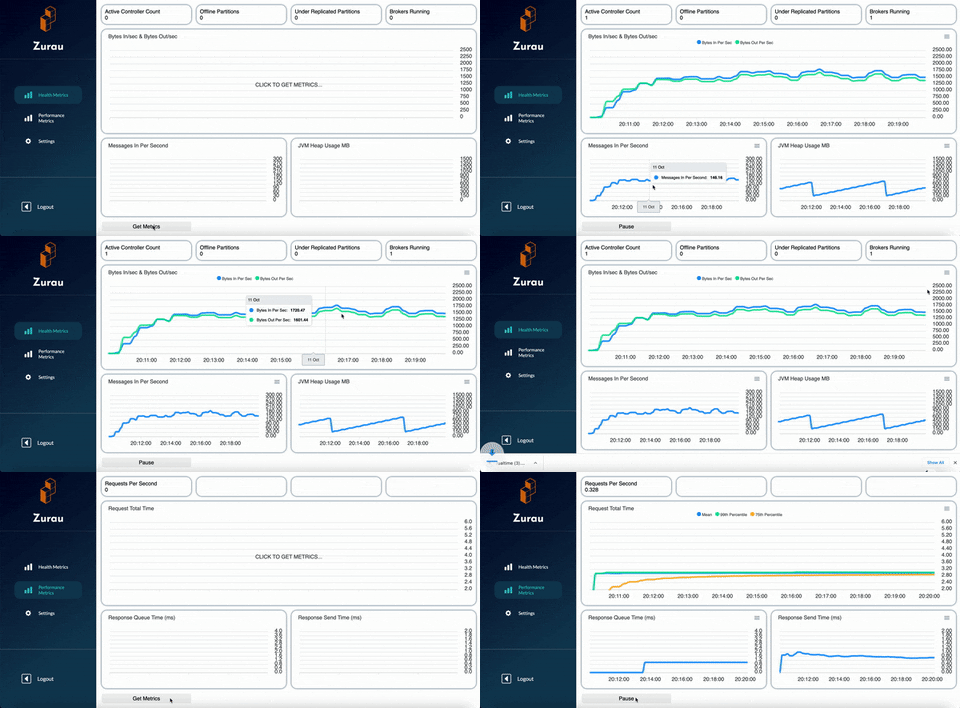
KafkaPeek is a developer tool that monitors key metrics in your local Kafka deployment.
- Bytes In Per Sec
- Bytes Out Per Sec
- JVM Heap Usage (MB)
- Under Replicated Partitions
- Offline Partition Count
- Active Controller Count
- Brokers Running
- Requests Per Sec
- Request Total Time (s)
- Request Queue Time (ms)
- Response Send Time (ms)
Client: React, React Router, ApexCharts, Socket.io
Server: Node, Express, Socket.io KafkaJS
DevOps: Apache Kafka, Prometheus, JMX Exporter, Grafana, Docker, Git, Github
- Live monitoring of key health metrics of a Kafka Broker
- Secured login through Github OAuth
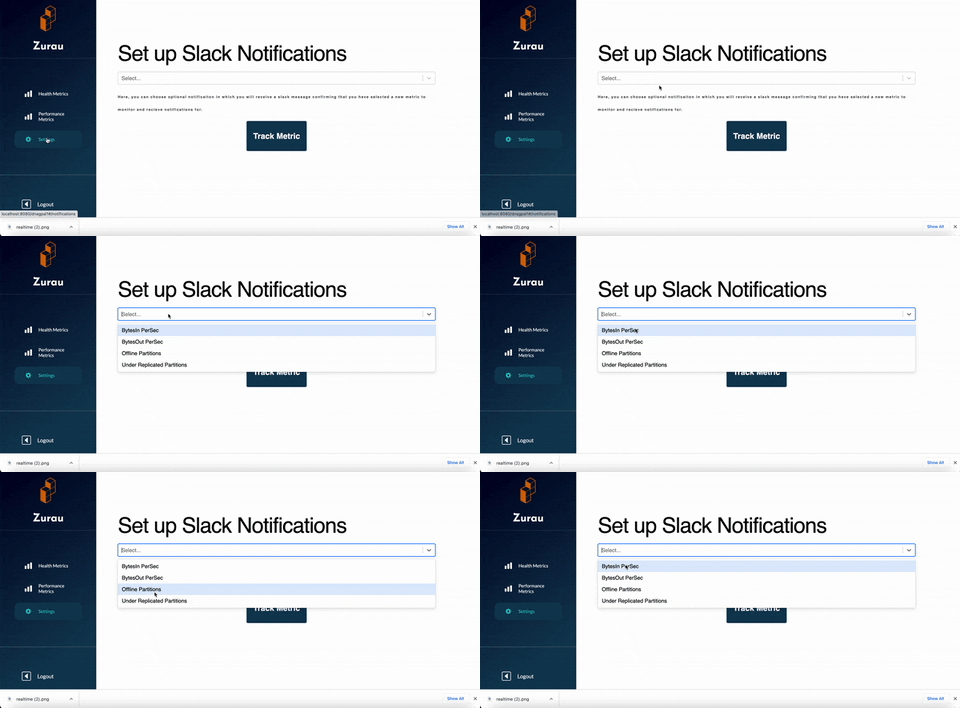
- Slack alerts if metrics go beyond user set specifications
- Customization of dashboard metrics based on the organizations needs
- Ability to save graphs in real time
Install KafkaPeek with npm to install all dependencies
npm installTo deploy this project run the following commands in the terminal:
- Deploy your kafka cluster
docker-compose up- In a new terminal window, deploy the producer:
npm run start:producer- In a new terminal window, deploy the consumer:
npm run start:consumer- In a new terminal window, deploy the application on:
Deploy application on dev server (localhost:8080)
npm run devOR
Deploy application on production server (localhost:4000)
npm run buildthen
npm startNow you have a fully functioning Kafka broker with one demo producer and consumer.
To run tests, run the following command
npm run test socketIOtest.js npm run test supertest.js- Web Based Application
- Customized Developer Options
- Github OAuth Authentication
- User Account Information
- User Settings
- NoSql Database - Error Logs/Accounts/Archived Metrics


