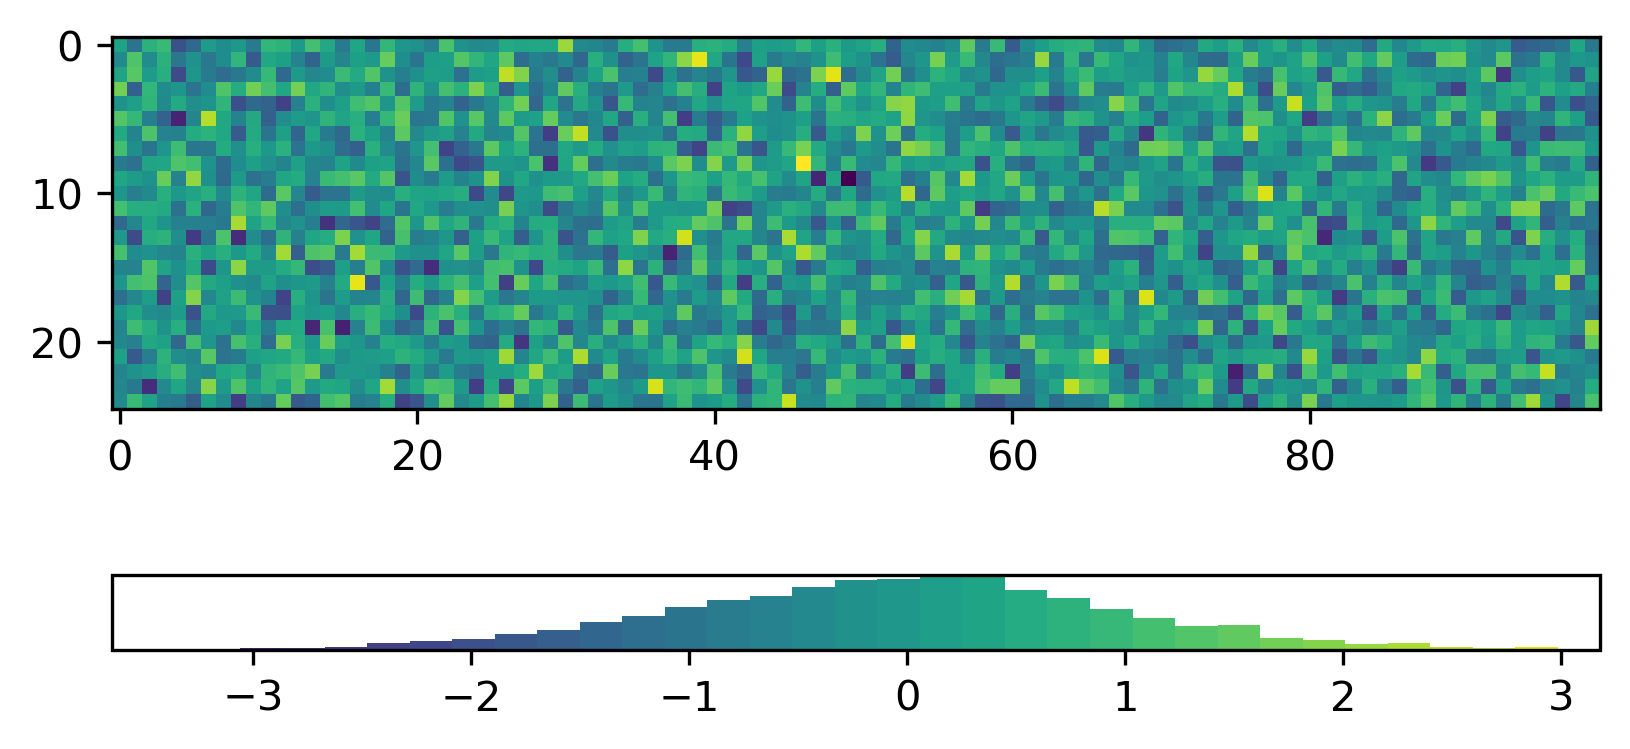
A drop-in replacement for matplotlib's colorbar that shows the frequency of each color in the mappable.
mpl-histcolorbar is available as mpl_histcolorbar on PyPI:
pip install mpl_histcolorbarimport numpy as np
import matplotlib.pyplot as plt
from mpl_histcolorbar import histcolorbar
rng = np.random.default_rng(seed=42)
data = rng.standard_normal(size=(25, 100))
fig, ax = plt.subplots()
im = ax.imshow(data)
hcb = histcolorbar(fig, im, location="bottom")Documentation is available at mpl-histcolorbar.readthedocs.io.
Original code is licensed under the MIT license. This project directly derives from matplotlib, and any use of this project is subject to the matplotlib license agreement.

