-
Notifications
You must be signed in to change notification settings - Fork 111
Error Reporting, July 2016
The July release brings with it a complete overhaul of Pyret's error presentation. Nearly all errors messages have revised wording and presentation, testing reports are more expressive and navigable, and a handful new error types have been introduced to improve the reporting of misuses of Pyret library functions.
This overhaul imposes no new runtime penalties, and did not require storing additional debugging information in compiled Pyret programs. As before, the internal error structures contain limited location information. For example, arity-mismatch errors attempt to reconstruct the function application location by inspecting the stack. This location information is too coarse to extract the locations of the applicant or the arguments, so that information might be reconstructable by re-parsing the source code at that location. That source location might be a dummy location, leaked from desugaring, or the location of a function implemented in pure javascript. We’ve accounted for all of these cases with various fallbacks, and are still learning about the best way to present errors in all these situations.
Textually, these messages strive to:
- explain what expectation was violated,
- explain why that expectation was violated,
- include references to any relevant syntactic elements
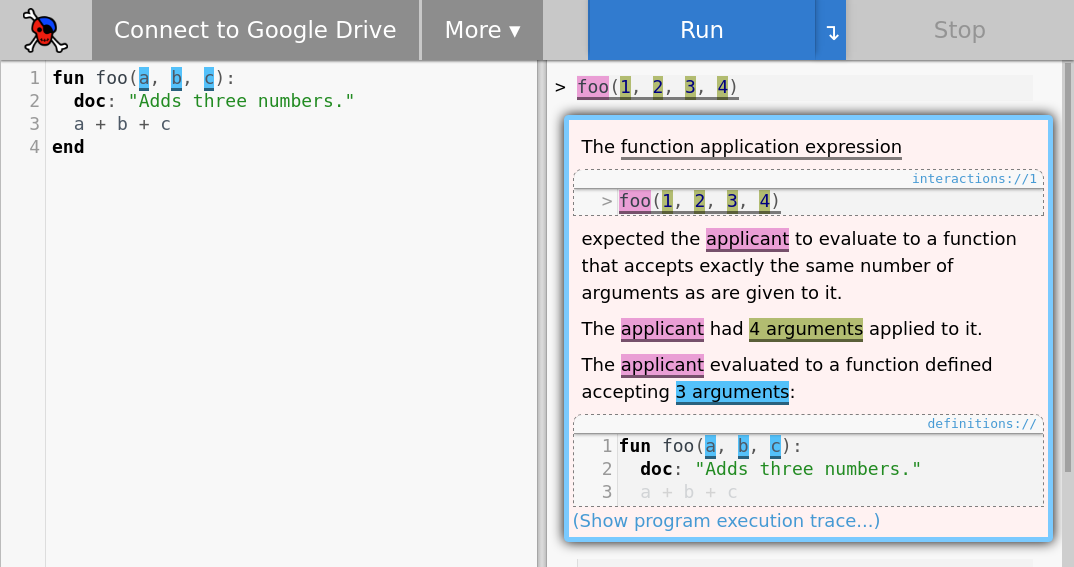
References between the error message and the source code are made visually explicit by highlighting their respective spans of text in a common color. For example, the rendering of an arity-mismatch error,
 considers that the programmer may have:
- not intended to call a function,
- called the wrong function,
- called the intended function, but with the wrong number of arguments,
- called the intended function, but had defined it with the wrong number of arguments
Respectively, that error message identifies and highlights:
- the function application expression,
- the applicant,
- the arguments of the application expression,
- the arguments accepted by the function definition
Only one error message is permitted to display its highlights at a time. If an error message's highlights are displayed, the message box is given a blue outline. Clicking on an inactive error message box displays the highlights of the clicked message box. To learn more about how Pyret handles situations with multiple error messages, read the Test Reports section.
Highlights have supplanted string-formatted source locations as the preferred means of referencing user code in an error message. Hovering over a highlighted phrase in a message flashes the highlight on all highlighted spans referencing the same location. Clicking on a highlighted phrase in a message scrolls the editor to the referenced source location.
Snippets allow small views into the user's code to be embedded in an error message. For errors with many or nested relevant syntactic elements, snippets provide a visually simpler alternative multi-layered highlighting. Snippets allow for a message to be read in its entirety without pausing to 'dereference' the destination of a highlight. Snippets can be used when the goal is to communicate context, but not culpability (see Stack Traces).
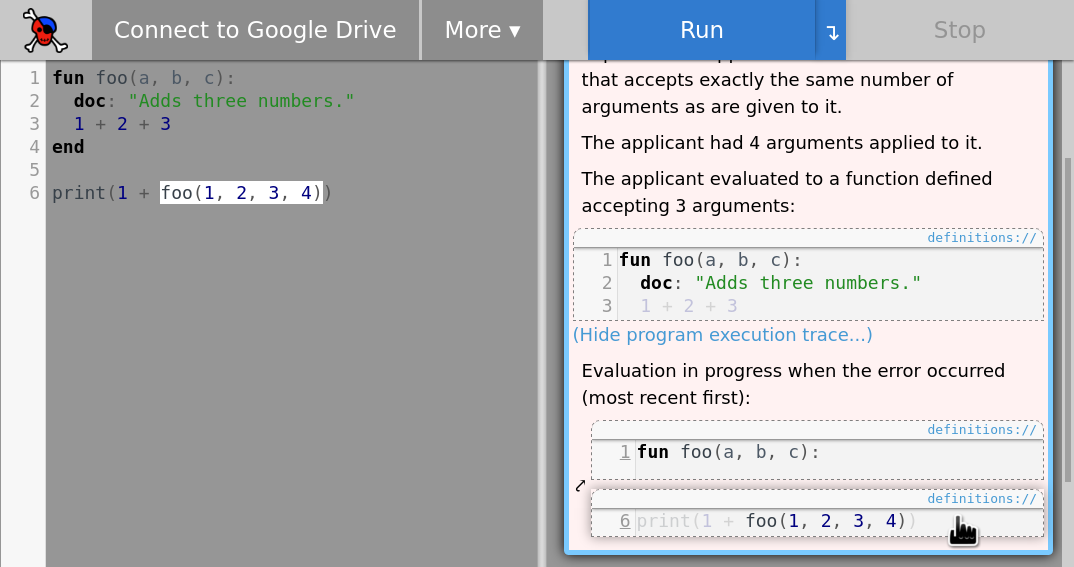
Clicking Show program execution trace... at the bottom of an error message displays the stack trace up until the point of failure, rendered as a list of single-line snippets (or, when the source is not available, as a formatted stack location). Hovering over a snippet displays a 'spotlight' visual effect:

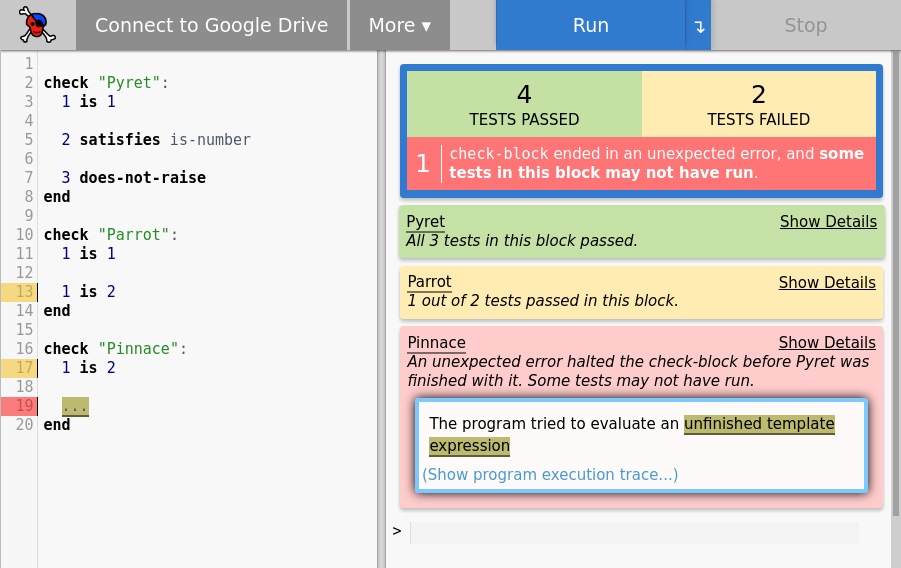
Testing results retain the overall layout of previous Pyret releases, but with many small interface improvements. The summary view, shown below, gives an at-a-glance overview of the overall test results, and a summary of the outcomes of each check block. Failures that unexpectedly halt the execution of a check block are given special precedence, since they may have halted execution before all tests in that block could be run.

The results of individual tests can be viewed by clicking Show Details on that test's block's summary in the report. Clicking on a test result reason activates the highlights for that test. Clicking on the underlined titles of check blocks and tests scrolls the location of the block or test into view.
New in this release, all testing failures caused by exceptions include the full-fledged rendering of that exception, including a stack trace.
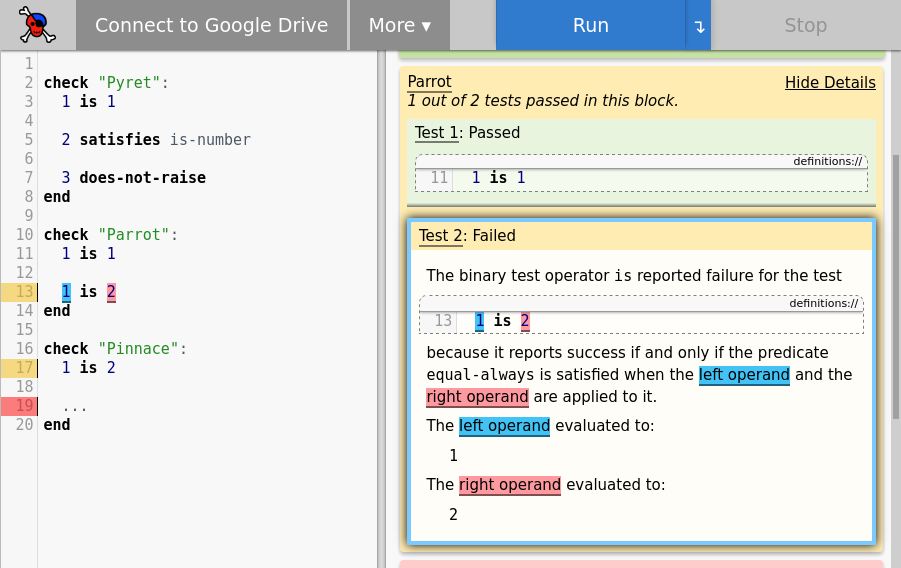
The detailed failure report for any failing test can additionally be accessed by clicking on the yellow-highlighted line number of that test. For example, if we click on line 13, the detailed failure report for 1 is 2:

Errors that halt the execution of a check block are, when possible, also given a clickable gutter marker that indicates the point of failure. When a point of failure cannot be determined, the gutter marker is placed on the same line as the check keyword of the errored block.