Releases: LowPowerLab/RaspberryPi-Gateway
REQUEST changes & misc catch up fixes
9.2.1

Commit for 9.2.1
Misc fixes & package upgrades
9.2.0

Update package.json
9.1.0 - metrics reorganized, UI improvements
The most important change is the way metrics are now organized into the new metrics folder and broken down into modules.
Many other improvements, all documented in this blog release.
v9.1.0 BETA
9.1.0 BETA
Multi Graphs & HTTP Endpoint (v9.0.0)
Please see the release notes for 9.0 for new features what has changed.
Minor fixes (v8.11.1)
Fixed serialport.open() error and Buffer() use - replaced with Buffer.alloc() in logUtil.js
NodeJS & packages updates (v8.11)
This is a NodeJS and node packages update
The setup script is changed to install the latest nodeJS version regardless of the Pi version, tested on Pi3/B+ with RASPBIAN STRETCH LITE (v. June 27, 2018).
To install from a fresh image just run the setup script as shown in the Guide.
If you update from a previous version, make sure to backup your Pi before you update.
You may manually replace the changed files and then restart from the web UI or by running:
- restart app (
sudo systemctl restart gateway)
Changed files:
- gateway.js - required changes for serialport
- package.json - various packages updated
- www/socket.io/socket.io.js - (client update to latest 2.1.1)
- .setup/gatewaysetup.sh
Node settings & lots more (v8.10)
This is a feature and misc bug fixes release.
If you update from a previous version, make sure to backup your Pi before you update.
This update will require 2 main manual actions from your part (if updating):
- run
npm install(should install new suncalc package) - restart app (
sudo systemctl restart gateway)
Changed files:
- gateway.js
- metrics.js
- settings.json5 (requires manual migration of your own settings)
- package.json ( run
npm installfor new suncalc package ) - www\images\icon_template.cdr - added battery icon
- lowbattery.png warning icon
- www\index.html (main UI front end)
Main new features:
-
Node/overridable settings
If you'd like a particular global setting (from settings.json5) to be overridable in a node (for instance minimum voltage for battery powered nodes) you can now do so in metrics.js by using the new settings section under exports.motes, note that the included settings must match the name in settings.json5 or they will be ignored. Example from exports.motes.MotionMote:

Then on nodes of that type, the setting can now be set a custom value:

-
Wifi RadioThermostat CT50 IP setting support
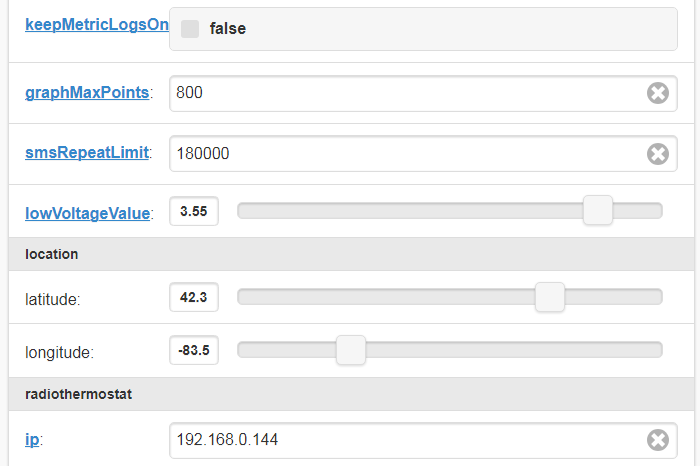
Specific code for the CT50 was updated to support a new IP setting in the UI. This allows the user to override and set the IP of a thermostat on the node page, thus enabling having multiple thermostats with different IPs in the app:

-
New settings types
This enables more user friendly settings. Supported types are jQuery mobile HTML5 defaults, and examples of how to use these are found in the settings.json5 file:
- checkbox - for true/false settings
- number
- password - obsoletes setting.password:true/false
- range - min, max
- default (no type) is text
A few examples using new types:

-
email attachments
The sendEmail function in gateway.js has a new parameter where you can pass the URL of an attachment to include in sent emails: global.sendEmail = function(SUBJECT, BODY, **ATTACHMENTS**)
Example email with attachment:

-
Scheduled events time remaining & datetime
Scheduled events now show time remaining until they will run, and the datetime when that happens

-
Sunset/sunrise API for events
Based on suncalc, this node API allows creating events that run at various times during the day based on calculation of the sun position. A few examples are:
- sunrise
- sunset
- solarNoon
- goldenHour
- dusk
- dawn
To calculate these events, the latitude/longitude coordinates can be provided on the general settings page:

UI changes / new features:
-
Ctrl+ALT+Shift+R keyboard shortcut
Requests the gateway app to restart
-
New All Events page which shows all scheduled and disabled events:
-
Modified menu:
-
RSSI is a metric and logged/graphed by default:
Other / MISC:
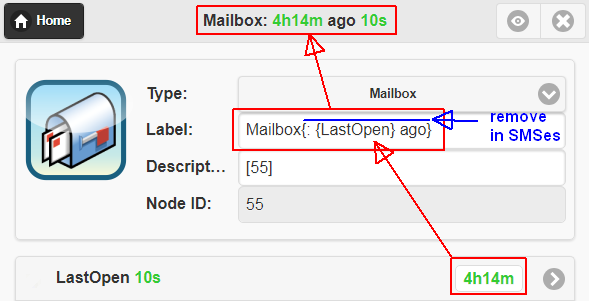
- clean up of cryptic SMS messages when they included custom labeling, ie. ability to add another set of
{}brackets around text that should not be included in SMS messages:

Result is a clear SMS message:

autoscaleTop/autoscaleBottomoption for flot graphs. This is a special option to allow graphs to scale down from min/max values. The originalautoscaleoption did this for both top/bottom of the graph. With the new autoscaleTop/autoscaleBottom options, you can specific this to be done only at the top or bottom, see metrics.js file for the V metric definition example
Node data CSV export & misc fixes (v8.9)
New features
-
Add "excel timestamp" columns in CSV exports. You can now open the CSV in excel and simply format the column as date-time and that column will display each datapoint time.
-
New SMS limit setting - an SMS will only be repeated after this many milliseconds. Helps to limit repeats for things like repeated motion or alerts:

-
Moved "Restart App" in main menu
Other changes and fixes
- Settings page listview trigger create bug fix
- Added _example.js event override sample
- Fixed README.md titles
- Fixed AM/PM bug in SMS messages
- Updated exports.timeoutOffset function
- Setup script mkdir /data/db so pi would chown it
User metrics & other enhancements (v8.8)
Main changed files: www\index.html, gateway.js, metrics.js, package.json, removed gateway_NeDB-2-Binary.js, added userMetrics\README.md, added userMetrics_example.js
IMPORTANT NEW REQUIREMENT: merge nodejs package (get latest packages.json and run npm update in your gateway directory to install it). This is required for the main new feature (user metrics)
- user metrics folder, allows you to move your own custom metrics in a place where they don't mingle with the defaults in metrics.js, you can also override/change the existing defaults or add new ones, see README in userMetrics folder for details. You can customize a default metric by copying it from metrics.js, beautify it with jsBeautifier then paste it in your own
userMetrics/yourNewMetric.jsfile. For changes to take effect the app needs to be restarted at this point. Here's how to use jsBeautifier:

- updated nedb to 1.8, json5 to 0.5, request to 2.75, console-stamp to 0.2.4
- removed old neDB upgrade script (gateway_NeDB-2-Binary.js)
- (total log disk space / visible data disk space) in graph status:

- server uptime on terminal page:

- added support for flot curvedLines. Please note this will result in many interpolation points injected in the graph by this plugin, these are not part of the original logged data and the graph stat will still reflect the number of points used to generate the visible graph. The
userMetrics/_example.js"H" metric illustrates how to use it. Graph results in a smoother curve rather than stepped values:


