-
Notifications
You must be signed in to change notification settings - Fork 13
VIZBI 2015 Tutorial
This is the introduction page for the VIZBI 2015 tutorial session on 3/24/2015 (Tuesday) in Boston.
- 3/16/2015: Overview section updated.
- 3/3/2015: Lecture outline updated.
- 2/2/2015: Outline of lecture and links added
Cytoscape was a stand-alone desktop application designed primarily for point-and-click GUI operations. However, as biological data sets grow, biologists need to manage large-scale data analysis and visualization workflows which require some tools for automation. To solve this problem, we have developed a Cytoscape App called cyREST, a RESTful API module for Cytoscape.
In this tutorial, you will learn how to build reproducible network data analysis and visualization workflows with the following standard tools:
- Cytoscape 3.2.x
- cyREST App
- IPython Notebook (Jupyter)
- Popular Python libraries, such as NetworkX, Pandas, and Bokeh.
- Docker
- Some experience with Cytoscape
- You don't have to be an expert of Cytoscape, but some basic knowledge, such as networks, tables, and Styles might help.
- Basic knowledge of Python or similar scripting languages
- Just the basics, like primitive data types, conditional statements, and loops.
- We will use Python for examples, but will not go into details of Python-specific features.
- Familiarity with command line user interface
- cd, ls, pwd, etc.
- Git and GitHub (Optional, but helpful if you know some basics)
This tutorial session consists of two parts: quick tour of the latest version of Cytoscape (3.2.1) and building reproducible network data visualization workflow with modern environment.
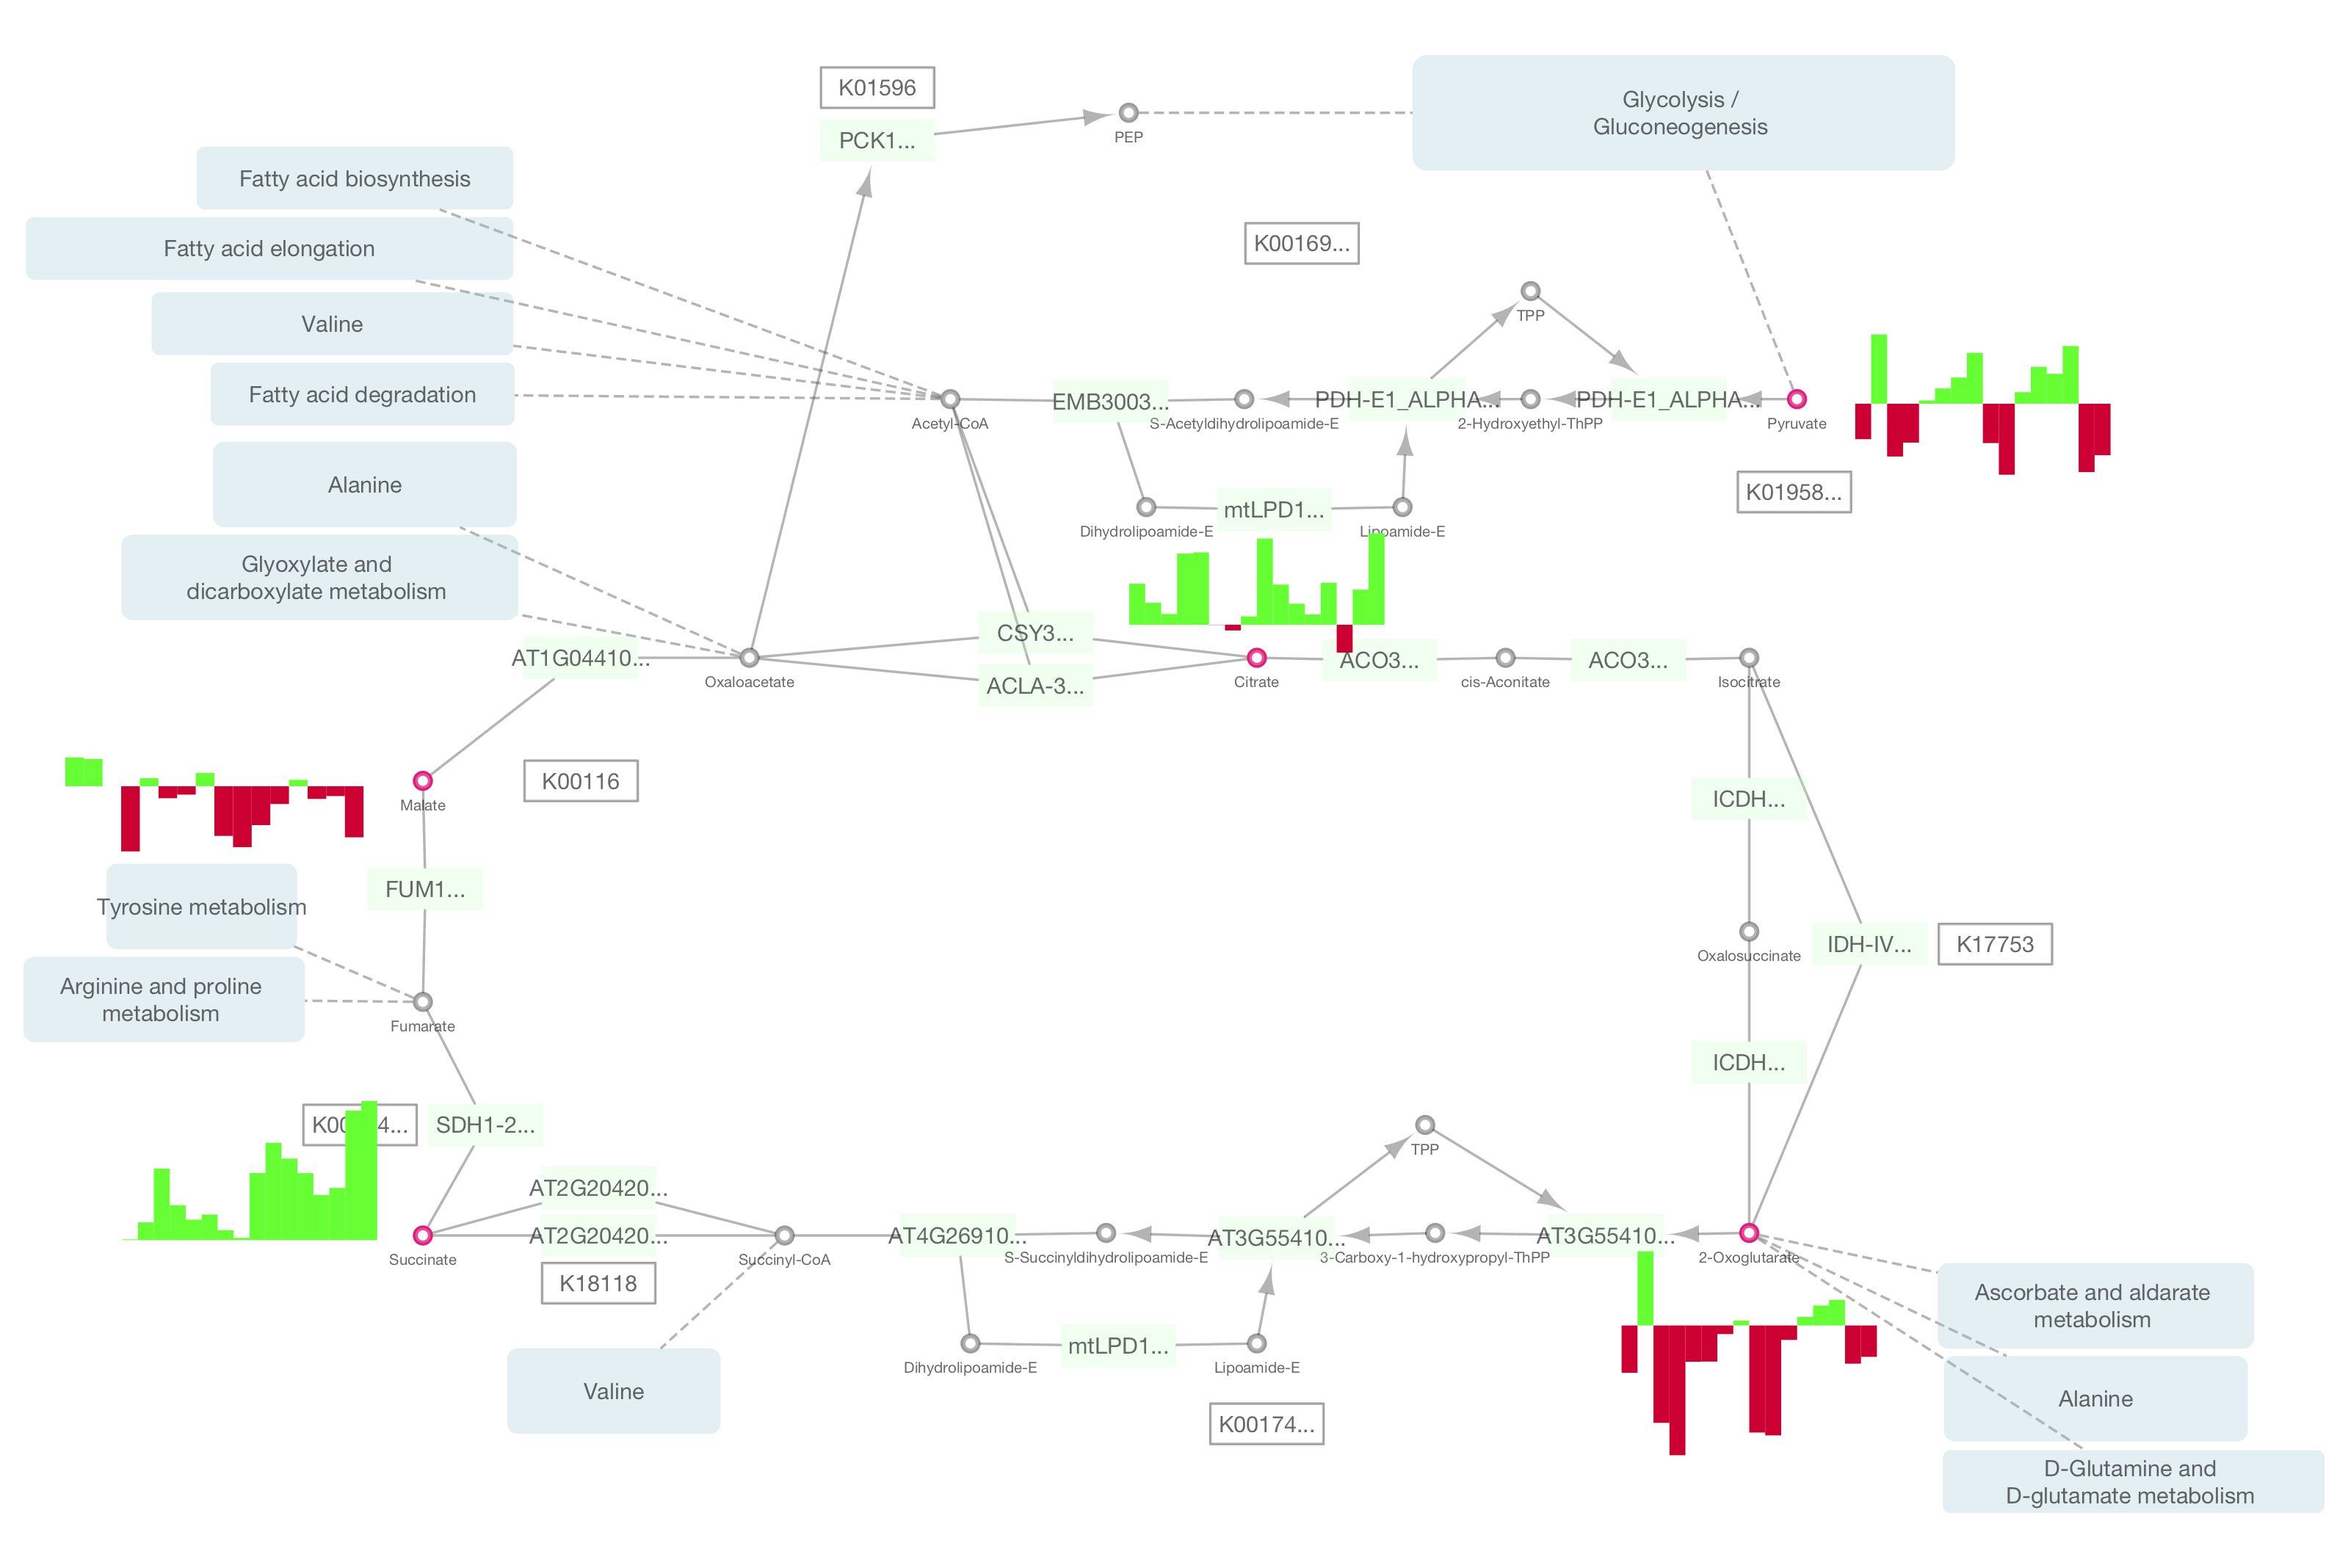
Part I will focus on introducing participants to new capabilities released with Cytoscape 3.2, including adding charts and graphs to nodes, publishing Cytoscape networks to the web using Cytoscape.js.
- Loading and manipulating network data in Cytoscape
- Visualizing data using Cytoscape Styles
- Charts and graphics onto nodes
- Adding graphical annotations such as text, images, shapes, and arrows to a Cytoscape network
- Export visualizations as a complete web application using Cytoscape.js
Part II of this tutorial will focus on reproducibility of your workflow. If you use Cytoscape as your workbench for network data visualization, you can share your results as Cytoscape session files or as images in PDF. But how about the process? In this newly designed tutorial, you will learn how to build your own workflow with modern data analysis tools.
- Why cyREST?
- RESTful API and Resource-Oriented Architecture
- Cytoscape-as-a-service
- IPython Notebook / Jupyter
- Reproducible workflows
- Sharable lab notebook for bioinformaticians
- Docker for Science
- Your data analysis environment as code
- Sharing the whole data analysis environment as a container
- Run your portable data analysis environment on Docker
- Docker Basics: start, stop, and remove containers
- Edit Dockerfile
- Build new image
- Drive Cytoscape via cyREST
- Call Cytoscape from your web browser
- Call Cytoscape from curl
- Call Cytoscape from IPython Notebook
- cyREST basics
- Create/load networks
- GET/PUT/POST/DELETE data objects
- Call external services
- Interaction / pathway databases
- Annotations
- Data integration with Pandas
- Simple network data analysis with NetworkX
- (Semi-) Automatic Data visualization with Cytoscape and Cytoscape.js
- GitHub for sharing your notebooks
- nbviewer - A simple way to share Jupyter Notebooks
- Docker Hub for sharing your data analysis environments
- (Optional) Publish your visualization as a Web Application
- Reproducible dry experiments
- Service-oriented world for biology
Since this is a very ambitious tutorial session packed with tons of new technologies, please setup your machine before the session!
- Mac OS X Mavericks or newer
- Windows 7 or 8 (64 bit version ONLY)
- Ubuntu (14.x highly recommended)
The workflows may work on other platforms, but not tested.
For part 1, we will use traditional-style software installation, which is, install all software packages directly on your machine. Here is the list of required software:
These are easy to install. Simply double-click the installers and follow instructions.
Note: Currently, we have an issue to install latest version of cyREST from App Manager. To install the latest one, please use the Install button on the App Store page.
Usually, you need to install lots of software packages manually when you work on data analysis and visualization projects. However, for this tutorial session, the only required software packages you need to install are Docker and Git.
There are many books and free documents about Docker and git:
Examples and notebooks will be distributed via GitHub repository and you need to know at least how to clone the repository.
If you need GUI client, there are several choices:
To share your notebook and images through GitHub, you need an free GitHub account. Here is an excellent document how to setup yours:
git clone https://github.com/idekerlab/vizbi-2015.git
There are good documents for each platform at Docker web site:
- Introduction to Docker - First few sections are free. Highly recommended
After you install Docker (and boot2docker if necessary), make sure you can run the sample container on your machine:
For Windows / Mac Users (Boot2docker)
docker run -i -t ubuntu /bin/bash
For Linux Users
sudo docker run -i -t ubuntu /bin/bash
If you can run some shell command, like ls, now you are ready to go!
The entire workflow will be executed in the container we provide.
- I cannot access my container
If you use boot2docker, you are running Docker container in a virtual machine and you cannot access container's services from localhost. To check the IP address of the VM, type:
boot2docker ip
Sample rc file:
export DOCKER_HOST=tcp://192.168.59.103:2376
export DOCKER_CERT_PATH=/Users/kono/.boot2docker/certs/boot2docker-vm
export DOCKER_TLS_VERIFY=1Please send your questions to cytoscape-discuss Google Group or directly to me (kono at ucsd.edu).
© 2014-2016 The Cytoscape Consortium
Developed and Maintained by Keiichiro Ono (UC, San Diego Trey Ideker Lab)


