The pedometrics package was originally created to share the developments of my PhD research project entitled Contribution to the Construction of Models for Predicting Soil Properties (2012-2016) carried out under the supervision of Dr Lucia HC Anjos (Universidade Federal Rural do Rio de Janeiro, Brazil), Dr Gustavo M Vasques (Embrapa Solos, Brazil), and Dr Gerard BM Heuvelink (ISRIC – World Soil Information, the Netherlands). The idea of creating a package came from an observation that was bothering me for some time: several of the pedometric methods that I saw on published scientific papers were not being broadly employed as I would expect. But why? The answer seemed straightforward: because they were not available as a computer program ready to be used. This was also making it difficult to reproduce the analyses carried out by others. Creating a generic package for R – a popular programming language among pedometricians – could be a solution.
The current pedometrics package is an implementation of
miscellaneous functions for various pedometric purposes. This includes
the calibration of multiple linear regression models, the computation of
summary validation statistics, the generation of plots, the evaluation
of the local quality of a geostatistical model of uncertainty, and so
on. Other functions simply extend the functionalities of or facilitate
the usage of functions from other packages that are commonly used for
the analysis of soil data. Among these, one of the functions that I find
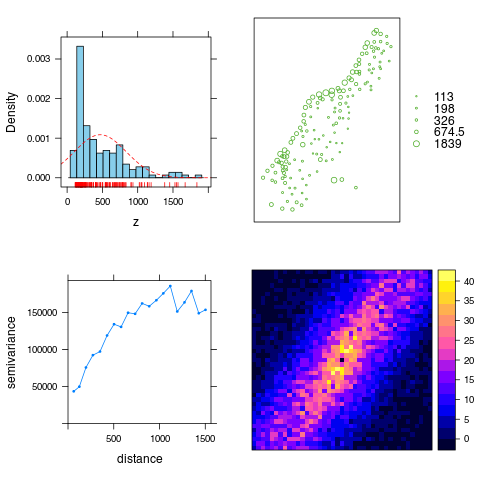
very useful is plotESDA(). This function creates four plots for
exploratory spatial data analysis (ESDA): a histogram + density plot, a
bubble plot, a variogram plot, and a variogram map. The figure below
shows the result for the zinc concentration in the Meuse river data set.
The latest stable version of the pedometrics package generally can be installed from the Comprehensive R Archive Network (CRAN).
# Install package pedometrics from CRAN
install.packages(pkgs = "pedometrics")
If installation from CRAN fails, you can install the development version of the pedometrics package available on GitHub using the remotes package. If you are using a Windows machine, however, you will need to install Rtools first.
# Install package pedometrics from GitHub
if (!require(remotes)) {
  install.packages(pkgs = "remotes")
}
remotes::install_github(repo = "laboratorio-de-pedometria/pedometrics")
We use the fork & pull collaborative development model. This means that you have the freedom to make a parallel copy – fork – of this repository, edit the source code as you see fit and then send – push – the changes to your personal copy of this repository. You can do all this without asking any permission. In case the changes that you have made in your personal copy of this repository are interesting and you have the interest of sharing them with us, then all you have to do is require them to be pushed – pull request – to this repository. After a review of the changes, we will decide if they can be merged – merge – with the source code of this repository.

